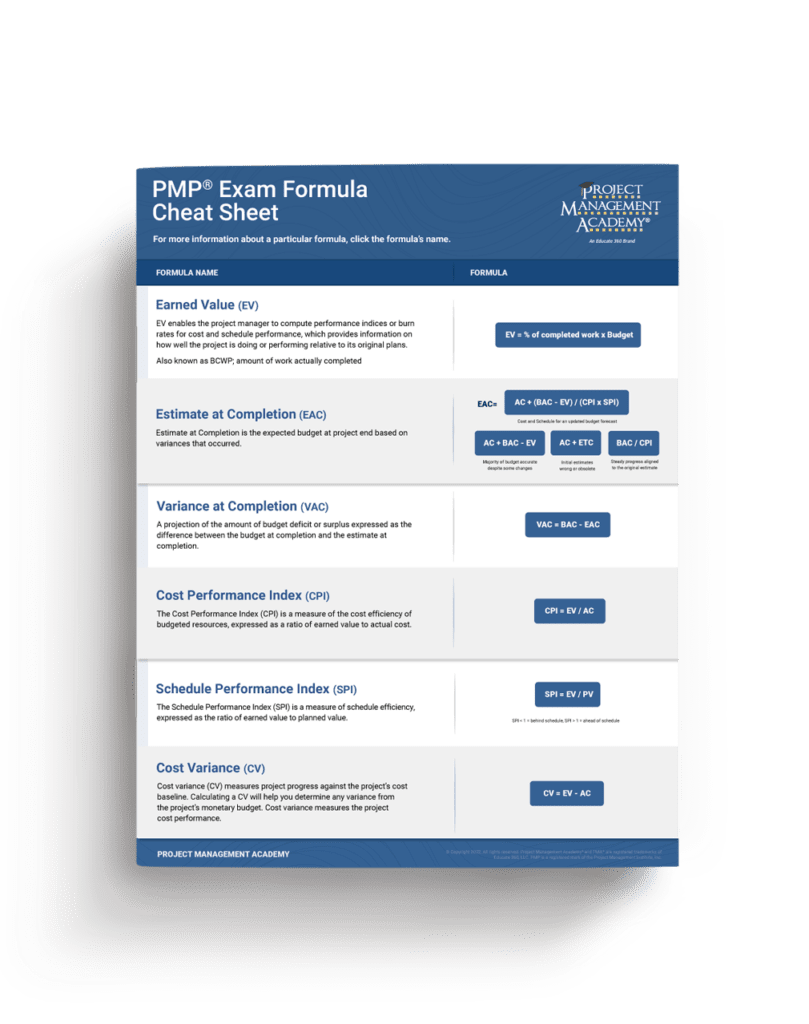
The Program Evaluation and Review Technique (PERT) is used to find the estimated time for activities to be completed when there are many unknown factors. With origins in the US Navy, PERT has been in use for over 60 years, speaking to the value it brings to project managers. The Project Management Institute (PMI)’s Project Management Professional (PMP®) certification exam may include questions referencing PERT, which is a three-point estimating technique used by project managers across industries to estimate activity duration or cost.
On this page:
PERT has been used across the globe, in many industries, and for decades. PERT has become the most used and popular method of choice among project managers due to its reliability and accuracy.
The PMBOK® Guide online lexicon provides this definition for PERT:
| Program Evaluation and Review Technique (PERT) | A technique used to estimate project duration through a weighted average of optimistic, pessimistic, and most likely activity durations when there is uncertainty with the individual activity estimates. See also analogous estimating, bottom-up estimating, parametric estimating, and three-point estimating. – Source: pmi.org/pmbok-guide-standards/lexicon |
Note the PMBOK® Guide definition is not “PERT PMP,” nor “PERT Analysis PMP,” as those are not the formal names for the technique. As for when in a project to use PERT analysis to determine a schedule or cost estimate, it is best during planning and implementation. Key points about PERT include:
When studying PERT as part of preparing to take the PMP® exam, it is important to know it is one type of three-point estimating, what it can be used to estimate (duration or cost), and when in the project to use it.

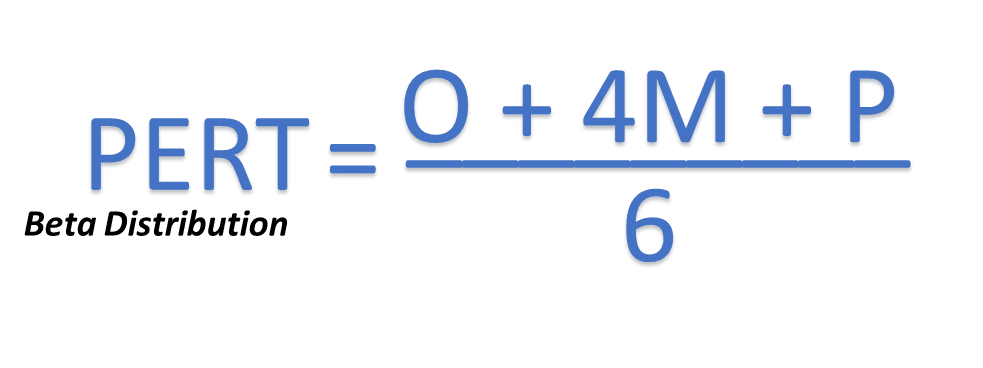
The M value, Most Likely, is given 4 weights as the PERT formula is based on probability theory and statistics, specifically Beta Distribution. More weight is given to the most likely (after all, it is the most likely). If plotted against a chart, this beta distribution will result in a more uniform, bell-shaped curve, called a normal distribution.
Within a large city, some factors influence how long it takes to drive from home to the office. The weather, the time of day, and any vehicle accidents on the road can impact the duration to get from home to the office on those roads.
| Most Likely (M) | 60 minutes | clear weather, clear roads, normal volume of drivers on some of the roads |
| Optimistic (O) | 30 minutes | clear weather, clear roads, no other drivers on any road |
| Pessimistic (P) | 120 minutes | thunderstorm with rain, road blocked from multiple vehicle accidents, the highest volume of drivers |
The weighted average of the three estimates is used in the PERT formula:
Staying with this example, consider if asked “how long does it take you to drive to work?”. Have you ever replied with “well, if it is a weekday at 8 am, it usually takes me 30 minutes longer than if it is a sunny weekend afternoon.” You are giving different estimates reflecting different situations for the same activity. Using PERT analysis, the estimates go from “guesses” to mathematically verified estimates.
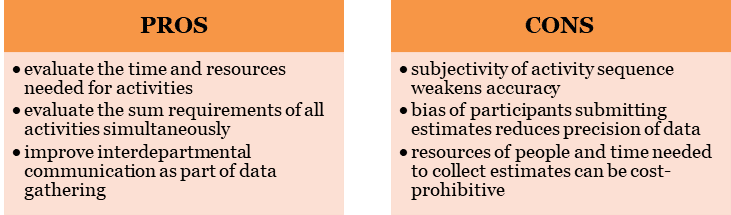
Program Evaluation Review Technique (PERT) is a project management planning tool used to calculate the amount of time it will take to realistically finish a project. PERT charts are used to plan tasks within a project — making it easier to schedule and coordinate team members. The Small Business Chronicle article What Are the Pros & Cons of PERT Charts? provides a breakdown of the advantages and disadvantages of the tool, summarized below:
PERT analysis PMP exam questions may include the need to calculate estimates using the formula or interpretation of graphed or charted data. Elements within a question can indicate if Beta Distribution using PERT is the best tool, e.g., experts are available, and the project is similar to other projects. Overall, in studying PERT PMP exam questions, be prepared to use the formula, do a basic analysis of a PERT estimate, and know when PERT is most effectively used.
| Question | A | B | C | D |
| You are a project manager working on a life sciences project. You are reviewing previous projects that are similar to get some estimating ideas. Additionally, you have met with vendors to get a sense of how long some activities may take if you decide to outsource. You are working on preparing your activity duration estimates and are meeting with the relevant experts to determine how long each activity should take. You know you will use PERT analysis to derive your figures. What indicators should you be gathering so that you can utilize PERT? | Triangular estimates | Pessimistic, Optimistic, and Most likely estimates | Best and Worst case estimations | Standard deviation |
| You are developing your project schedule and have decided to use the PERT method to determine project duration. The estimates you’ve gathered so far include the following: Most likely is 200 hours, optimistic is 180 hours, and pessimistic is 220 hours. Which of the following is the correct PERT estimate (beta distribution)? | 190 | 226 | 200 | 210 |
Studying for the PMP Exam?
The Program Analysis Review Technique, or as some refer to it, the “PERT Analysis PMP,” has remained a project manager mainstay because of the power to provide duration and cost estimates in situations with limited data. The time and resources needed to conduct a PERT analysis in the planning stages can be prohibitive but balanced out by the benefit of accurate estimates for the minimum needed to complete a project. Leveraging the three-point estimate technique, the PERT tool is a proven and practical estimating tool for communicating the activity needs and work of a project.
Answers to Sample Questions
Upcoming PMP Certification Training – Live & Online Classes
| Name | Date | Place | |
| PMP Certification Training | Sep 16,17,18,19 8:30am-6:00pm | Boston, MA | View Details |
| PMP Certification Training | Oct 14,15,16,17 8:30am-6:00pm | Boston, MA | View Details |
| PMP Certification Training | Sep 9-12 & 16-19 5:00pm-9:30pm | Online - Greenwich Mean Time (GMT) | View Details |